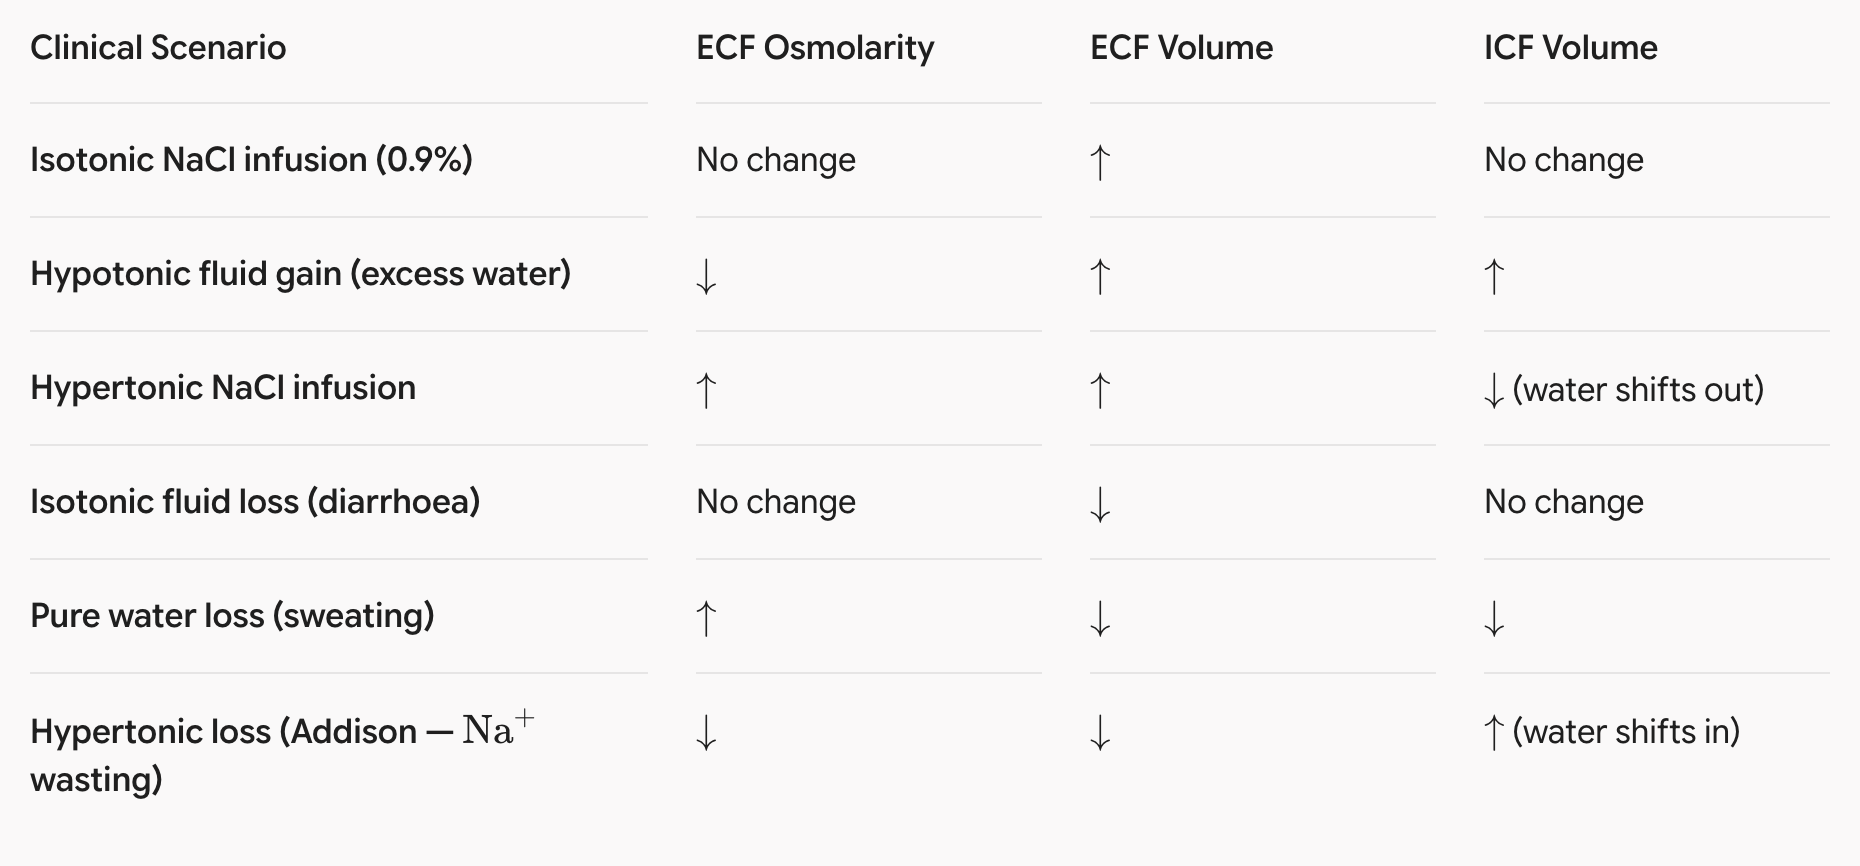
Compartments
| Compartment | Indicator | Logic |
| TBW (Total Body Water) | D_2O or Tritiated water | Goes everywhere water goes |
| ECF (Extracellular Fluid) | Inulin or Mannitol | Crosses capillaries but cannot enter cells |
| Plasma | Evans Blue dye or (125) I- Albumin | Binds albumin — stays intravascular |
| ICF (Intracellular Fluid) | Calculated: TBW - ECF | Cannot be measured directly |
| ISF (Interstitial Fluid) | Calculated: ECF - Plasma | Cannot be measured directly |
Distribution of body water
For a typical 70 kg adult male:
| Compartment | % body weight | Volume | Fraction of TBW |
|---|
| Total body water (TBW) | 60% | 42 L | 100% |
| Intracellular fluid (ICF) | 40% | 28 L | ⅔ |
| Extracellular fluid (ECF) | 20% | 14 L | ⅓ |
| Interstitial fluid (ISF) | 15% | 10.5 L | ¾ of ECF |
| Plasma | 5% | 3.5 L | ¼ of ECF |
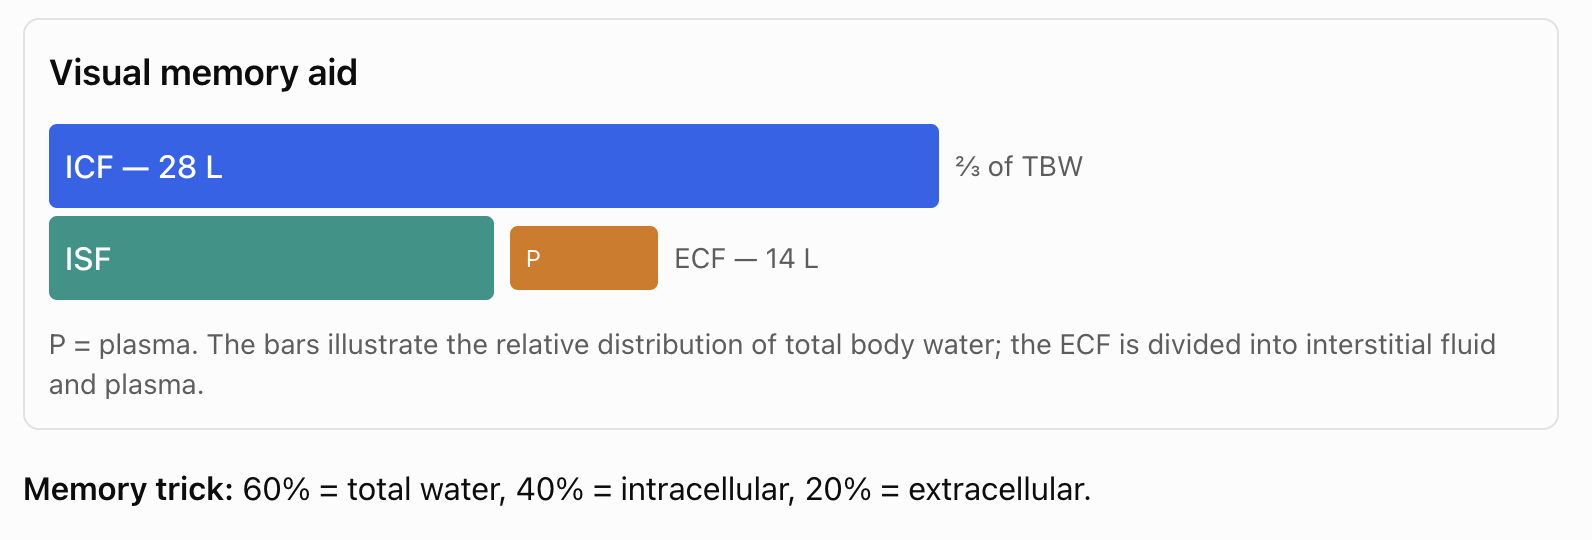
Visual memory aid
Factors affecting total body water (TBW)
| Factor | Effect on TBW percentage | Explanation |
|---|
| Increased body fat | Decreases | Adipose tissue contains less water than lean tissue |
| Greater skeletal muscle mass | Increases | Muscle is relatively water-rich |
| Neonatal age | Increases | Approximately 75% of body weight |
| Elderly age | Decreases | May fall to approximately 50% |
| Female sex, on average | Decreases relative to adult males | Average body composition generally includes a higher fat fraction |
FCPS pearl: TBW percentage depends on age, sex and body composition, so the 60% rule is an approximation, not a universal value.
Barriers between fluid compartments
| Barrier | Separates | Permeability and function |
|---|
| Capillary wall | Plasma and interstitial fluid | Water and many small solutes cross readily; plasma proteins are relatively restricted |
| Cell membrane | Intracellular and extracellular fluid | Selectively permeable; ion gradients are maintained by transport proteins and pumps |
Role of the Na⁺/K⁺-ATPase
- Pumps 3 Na⁺ out of the cell.
- Pumps 2 K⁺ into the cell.
- Uses one ATP molecule per cycle.
- Maintains high intracellular K⁺ and high extracellular Na⁺.
| Feature | ECF | ICF |
|---|
| Major cation | Na⁺ | K⁺ |
| Typical Na⁺ concentration | Approximately 142 mEq/L | Approximately 14 mEq/L |
| Typical K⁺ concentration | Approximately 4 mEq/L | Approximately 140 mEq/L |
| Major anions | Cl⁻ and HCO₃⁻ | Phosphates and proteins |
| Protein concentration | Low in ISF; higher in plasma | High |
| Glucose | Present in extracellular fluid | Rapidly utilised; concentration varies by cell type |
Ion values are approximate and vary by physiological conditions and measurement conventions.
Clinical Scenarios